
Navigation
Elvenar is a complex, open-ended game with many and various ways to accommodate your personal preferences. This page provides a overview of the various Forests that you’ll encounter throughout Elvenar. The Trees will be discussed on their own pages.
Servers and Worlds: Elvenar supports three different Servers that are localized for English speaking players: Beta, International, and US, plus more than a dozen other Servers that are localized for various languages. Each Server can support up to eight different worlds, which will all have an identical code base. InnoGames is comfortable with players who have Alts in several different worlds, which allows you to explore a variety of playing styles. The hazard, of course, is that your Alts are more than likely to spend extra Diamonds to “hurry things along” so that they can explore the interesting stuff that you’ve discovered elsewhere.
Software Environment: Elvenar is supported on a Cloudera Distributed Hadoop with a mix of xml.balancing files which are typically cached by the client, plus json responses that are generated on the fly to define the current status of your city. While InnoGames does not provide users with API access to their databases, neither do they obfusticate their network traffic nor their client-side code, which is quite readable. We use the Developer Tools in the Edge Browser (which hangs in there even when the responses get fairly large) to capture the otherPlayerService json traffic that defines the status of the City that you are visiting. There’ are several rather interesting discussions on the InnoGames Blog, regarding the programming environment.
Fellowships and Neighborhoods: Fellowships, each with up to 25 players, are the primary organizational structure within each world, and as you explore your World Map you’ll discover more and more neighbors. On the mobile app you can only interact with the 200 or so cities in your neighborhood, plus the members of your Fellowship, while the browser version allows you to take a peek at any city by using the global roster. There’s no in-game global chat channel.
God Mode: There is never any direct interaction with other Players. Visitors can buff your larger Cultural Buildings, once every 23 hours, and they can contribute to your Ancient Wonders, but your city will never be damaged by other players nor is there any form of Player vs Player conflict.
Venues: Most of your city management activities will be supported by various popups. The Spire has its own venue, as does the World Map. On the World map there will be a sub-venue for each Province that has been Scouted but had not yet been conquered. On the Browser there’s also a venue that supports manual Single Player vs Environment combat.
Monitor Your City: The Google Spreadsheet that we are providing allows Casual Users to look at the design of other Cities near their own level, and borrow the ideas that are the most interesting. And then likewise share their own designs, which will hopefully be even more interesting.
Each city has a separate tab, wherein most of the heavy lifting occures.
16 us4 Katwick 2025I15 would be a typical label, which decomposes as
Chapter Server&World Year&Month&Day.We draw 4 different elements from the otherPlayerService network feed that’s captured by the Browser Developer Tools (Ctrl+Shift+i) when you visit other Cities.
technologySection: Which defines their current Research Chapter
(r,q): Which indicates the City’s location on the World Map
entities: Which is a list of ALL of the objects that are currently in place in their city
effects: Which is a list of the Enchantments and Spells that are associated with the buildings in their city.

After several rather complicated VLookups and other calculations, we can present:
The common name for each building, as displayed in-game
The location of each building, with a related map that’s filter sensitive
The Cultural contribution PER SQUARE for each of the various buildings
The expiration date for the various Enchantments and Spells that are explicitly related to each building. We’re only charting the “most important” of the effects that are applied to each building; for example we’ve sorted the Ancient Wonder effects to the end of the list, as they would otherwise obscure the other effects.
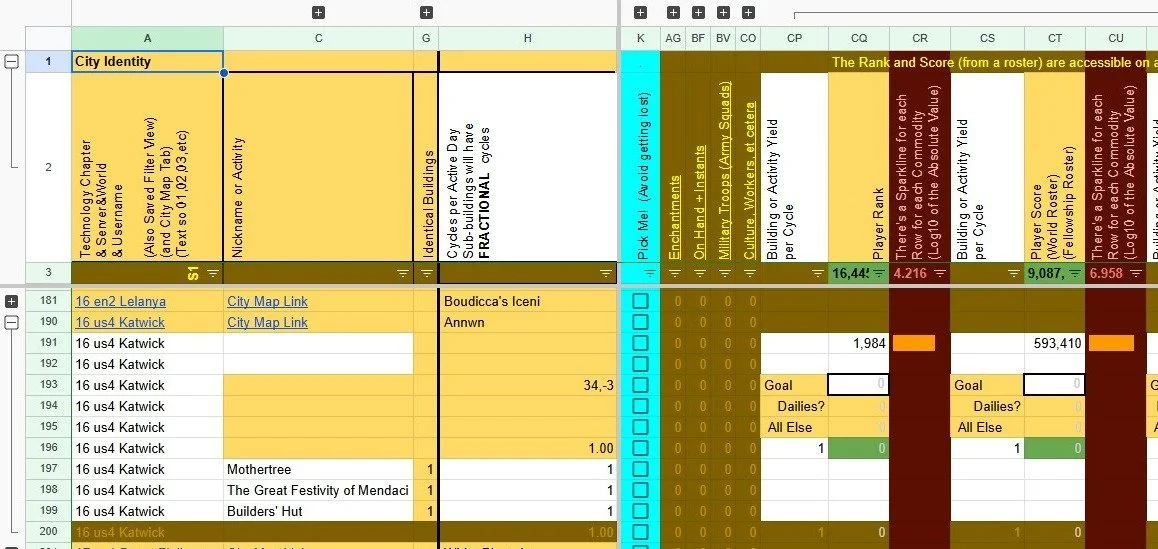
All of the cities are stacked in the ActiveDays tab, which has five elements
The first row of each stacked city includes a link to the Saved Filter View for that particular city, which is a shard with a preset sort and filter wherein you can sort and filter various rows without disturbing other players. As a bit of an aside, there are no indicators associated with the inherited (preset) sort order, which is why we’ve provided three different sortation macros. There’s also a link to the related City Map (and back again) and the Player’s Fellowship is indicated.
The second group of rows are Benchmarks for the more than 250 Commodities and Attributes that you may (or may not) wish to track at the moment. In particular, benchmarking the Player Rank Mouseover Scores, for the members in a fellowship, is an important, convenient, and very effective tool for Fellowship Management.
Each player has an isolated set of calculations for each commodity. This limits the scope of the calculation to just the commodity rows in single cities, so adding more buildings and more users doesn’t bog down the spreadsheet. It’s also, I might add, a huge pain from a programming point of view.
We’ve already mentioned the Benchmark section as a handy place for tracking the scores of fellowship players, But mostly the Benchmarks are there so that you can account for all of the “stuff” that you’re not concerned about at the moment. It’s true benefit is that it provides a carefully organized means for jotting down the current performance numbers that are sprinkled about in the game, and setting them up so that you can readily tell of you’re doing anything out of the ordinary. If some of the numbers are stable, then you may not need to benchmark them at all.
Other than the Sparklines, there are no calculations associated with the Benchmarks, and the Sparklines are just Eye Candy that will allow you to see, at a glance, how your benchmark numbers compare to those of other cities near your same stage of development.
The Numbers in Row 3 are scaling factors and sanity checks. They are the Max of the Absolute Values in that particular column.
Sparklines indicate the Log10(Max(Absolute(Value))), for the adjacent number, so the “midpoint” is at 10% of the maximum absolute value for that particular commodity. The length of the Sparkline is
10, 100, 1000, 10000, etc, rather than
10, 20, 30, 40, etc.
Your Goal is the amount by which you wish to shift the value of the current bookmark for that column. It can be either Positive or Negative
The next few rows are where all of the Spreadsheet Magic occurs.
The GREEN CELL is a very heavy duty ArrayFormula, that calculates the Row by Row Product of the numberOfBuildings * cyclesPerDay * yieldPer Cycle, which gives us the yieldPerDay for each Row. We WANT to retain the numbers that we have used, are using, or intend to use, so rather than deleting or updating them, we use a backtick to disable them, whereupon the calculation throws the appropriate blank. Note that zero IS a legitimate value when you’re simply not USING a building at the moment.
The absolute RANGE of the ArrayFormula calculation is its own row through the End of City Row, inclusive. The SIGNIFICANT benefit is that you can therefore freely add and delete the Rows BETWEEN the Top and Bottom of the Range, the ones with a white background, WITHOUT risk to any of the formulas other than the Sparklines which are just Eye Candy that you can recover with a simple drag.
All Else: If none of the local boxes in the Blue Column are checked, All Else is simply the Sum of the values in the local range.
The top row of the range, which contains the green ArrayFormula cell, will USUALLY be blank or zero. It’s available to validate the model, and for TEMPORARY values when you want to see what the effect of a change might be BEFORE you mess with your actual data.
The bottom row, which is also the Bottom of the City, will always be blank or zero.
Dailies: If any of the local boxes in the Blue Column ARE checked those Rows will be regarded at Active Rows, while the boxes that are NOT checked will be left as Passive Rows.
Days Remaining: = (Goal - Passive)/Active is the MAGIC NUMBER that’s the point of this entire exercise. There are a variety of techniques for finding the best value, including a Goal Seeking extension.